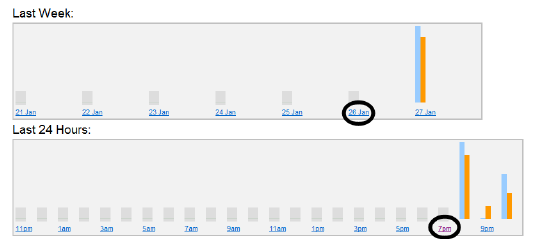
You can generate a report (Table or Chart form) based on minutes, hours, days, or months, and From and To specific dates using a calendar.

Detailed reports available by clicking on links for Last 24 Hours and Last Week reports

Hover mouse over bar chart for statistics
Click the Reports tab.
Select a format in which to display the collected data - Chart (histogram) or Table.
Click the From and To dates to select a date range from the calendars.
Select whether to generate a report based on intervals of Minutes, Hours, Days, Months.
For Minutes or Hours, select the From and To hours.
Click Update. The Chart or Table (format you selected) is displayed.
In Table format, it might appear that you have incomplete data for the current interval, displayed as n/a for “not available.” Click on the n/a link. Some data will be available for that interval (minute/hour/day/month).
If the interval is too large, an error message is displayed: “This report has too many records (number of records).”
After generating your report in Table format, click Export Data. A file manager opens.
If you click Open and your computer has MS Excel installed, the data is exported in Excel format. The MS Excel program opens automatically displaying the data in a worksheet. You can then save the data using that program.
If you click Save, the data is saved as text, comma-separated (.csv). You can open the file with MS Excel or another application for viewing text.
Because the Aimetis People Counter saves counters on a hourly basis, there may be up to an hour loss of counter data when a power failure occurs; the lost data will appear he reports as “n/a” or grey rectangle on charts.